


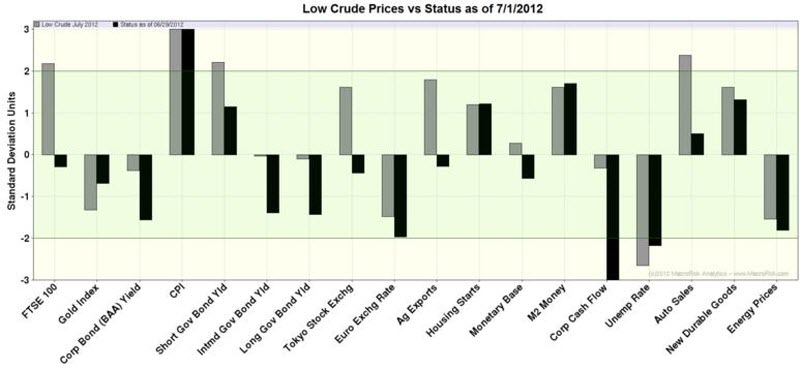
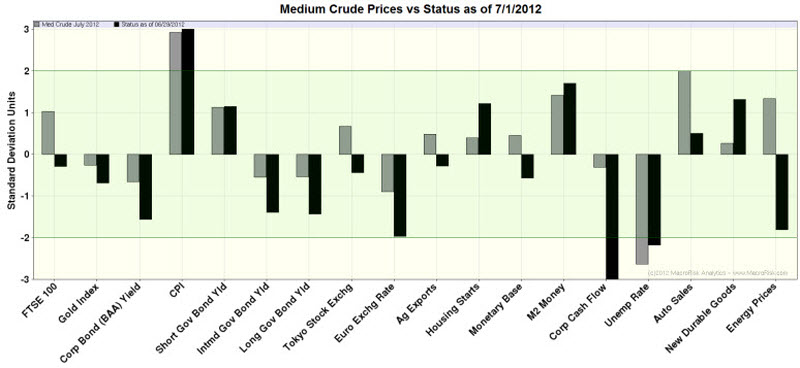
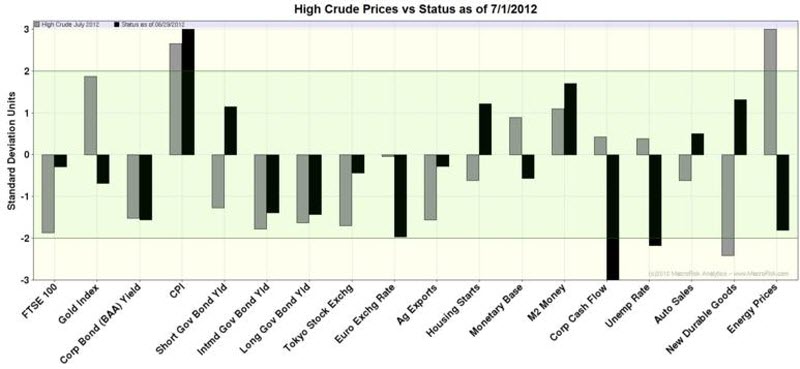
Comparing Global Oil ScenariosThese bar charts compare the conditions of the three Global Oil scenarios as of July 1, 2012 (black bars), with the conditions that existed at the time of the publication of the MacroReport-Global Oil issue, dated June 11, 2012 (gray-green bars). Each of the 18 MacroRisk Factors is represented by a corresponding bar on the charts. |
Global Oil: Home Global Oil: Optimized ETFs Global Oil: Optimized S&P 1500 Global Oil: Correlations of Returns and Values QuickResponse™ Portfolios InterActive: Home |
 June 11, 2012
  July 1, 2012 Source: MacroRisk Analytics
| LOW CRUDE PRICES |
|
| MEDIUM CRUDE PRICES |
|
| HIGH CRUDE PRICES |
|